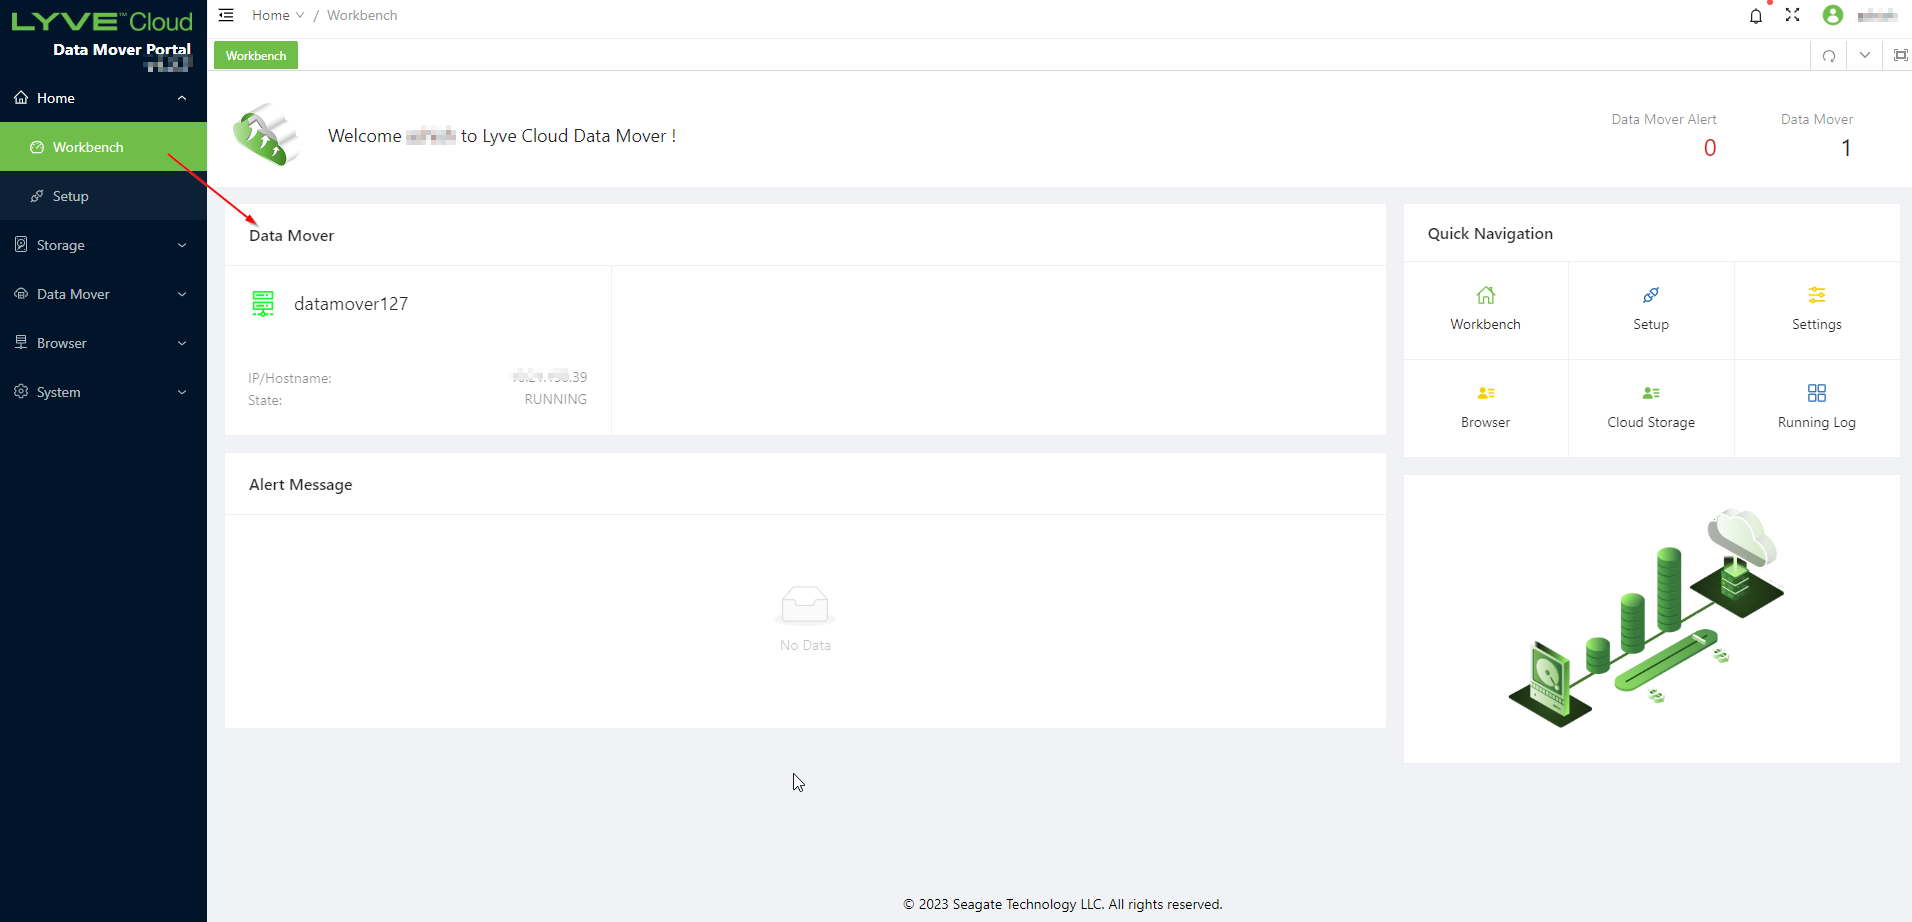
Understanding the Workbench
Workbench displays the following:
Data Mover: Displays the Data Mover's name and status. It also shows the IP address or the hostname of the Data Mover. The status can be Running or Stopped.
When you select the Data Mover, the following details are displayed.
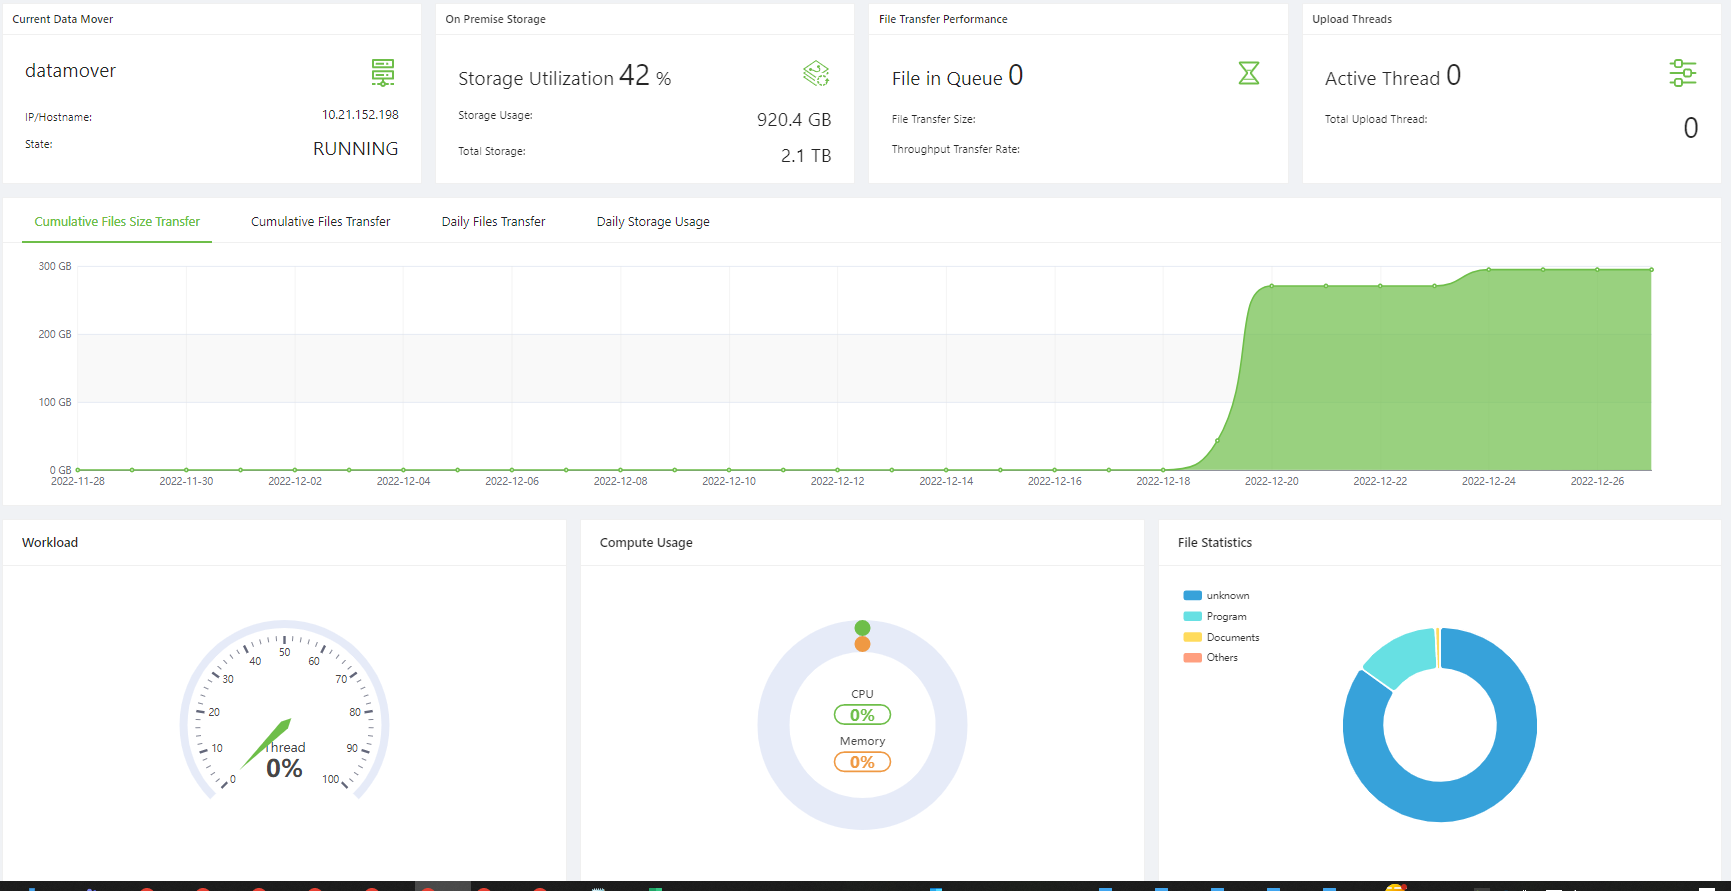
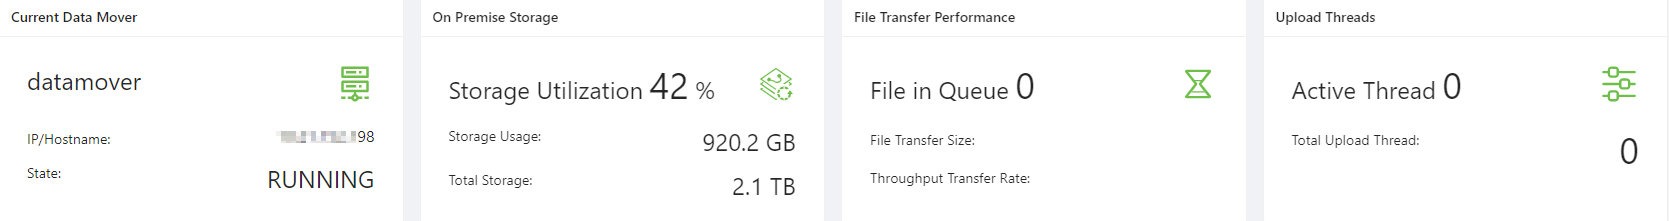
Current Data Mover: Displays the Data Mover Worker configuration details:
Data Mover Worker name
IP/Hostname: Displays the Data Mover Worker IP or Hostname (FQDN (Fully Qualified Domain Name)).
State - Displays the current state of the Data Mover Worker. The state can be Running, Stopping or No response.
On-Premise Storage: It displays the on-premises storage configuration details. It is a data source NAS storage mounted for Data Mover.
Storage Utilization: Displays the storage usage or the total storage in percentage.
Storage Usage: Displays storage utilized in GB for the data source NAS.
Total Storage: Displays the total available storage for data source NAS.
File Transfer Performance:
File in Queue: Displays the total number of Data Mover Worker files completed to scan and sync based on data source NAS and the pending queue to upload to Lyve Cloud.
File Transfer Size: Displays the total file size uploaded to Lyve Cloud for every Data Mover Worker sync cycle.
Throughput Transfer Rate: Displays the total file transfer size (MB) or the duration (sec) for every Data Mover Worker sync cycle.
Upload Threads: Specifies the upload threads configured for Data Mover for uploading files to Lyve Cloud.
Active Thread: Displays the active threads utilized to upload files.
Total Upload Thread: Displays the total threads configured to upload files.
Cumulative File Size Transfer: Displays the cumulative file size (GB) uploaded to Lyve Cloud.
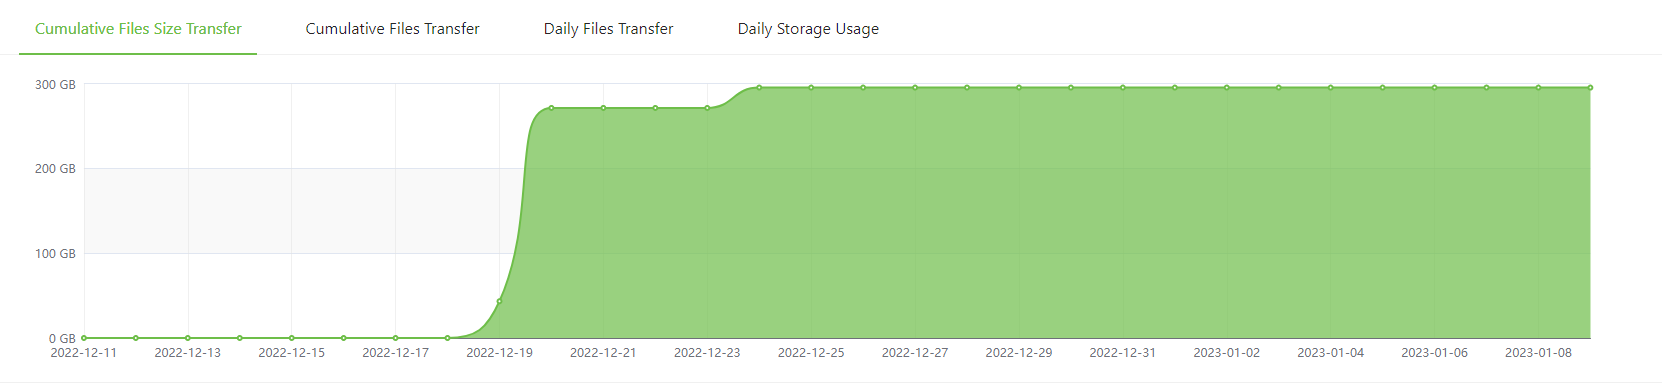
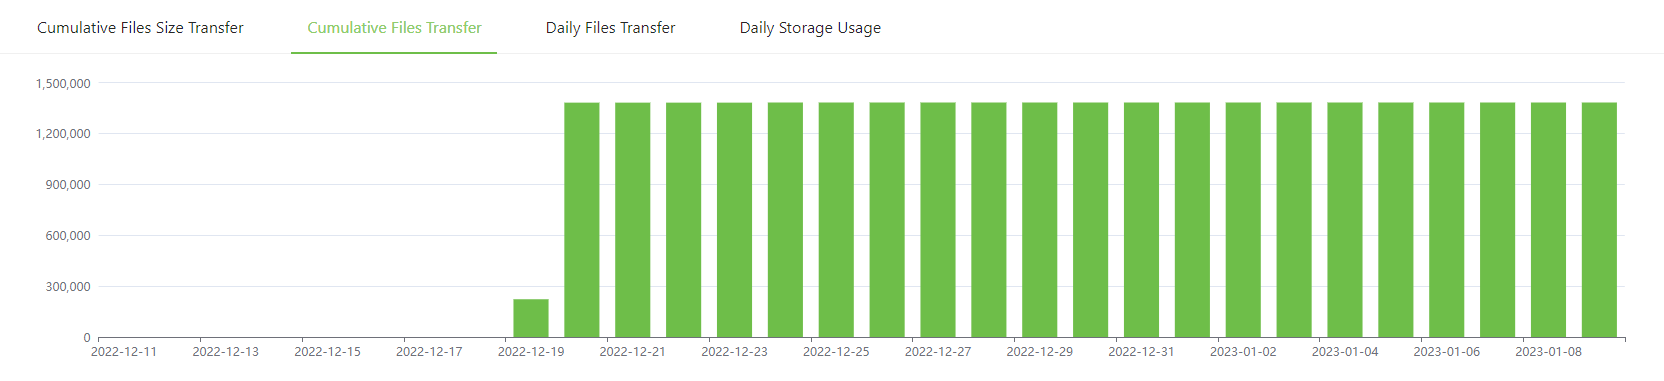
Cumulative Files Transfer: Cumulative files were transferred successfully to Lyve Cloud.
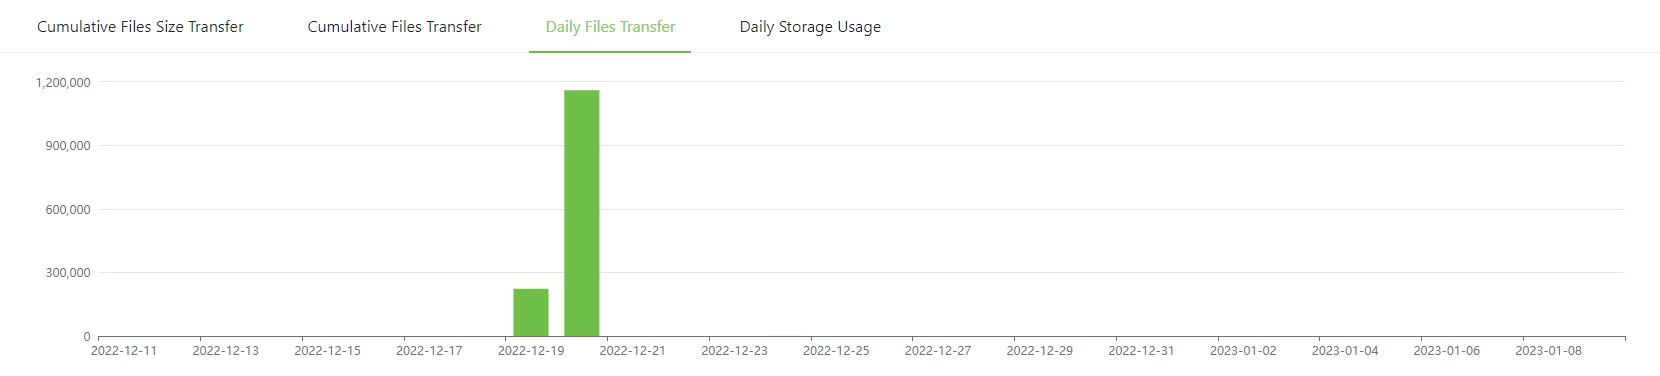
Daily Files Transfer: Total files uploaded daily to Lyve Cloud.
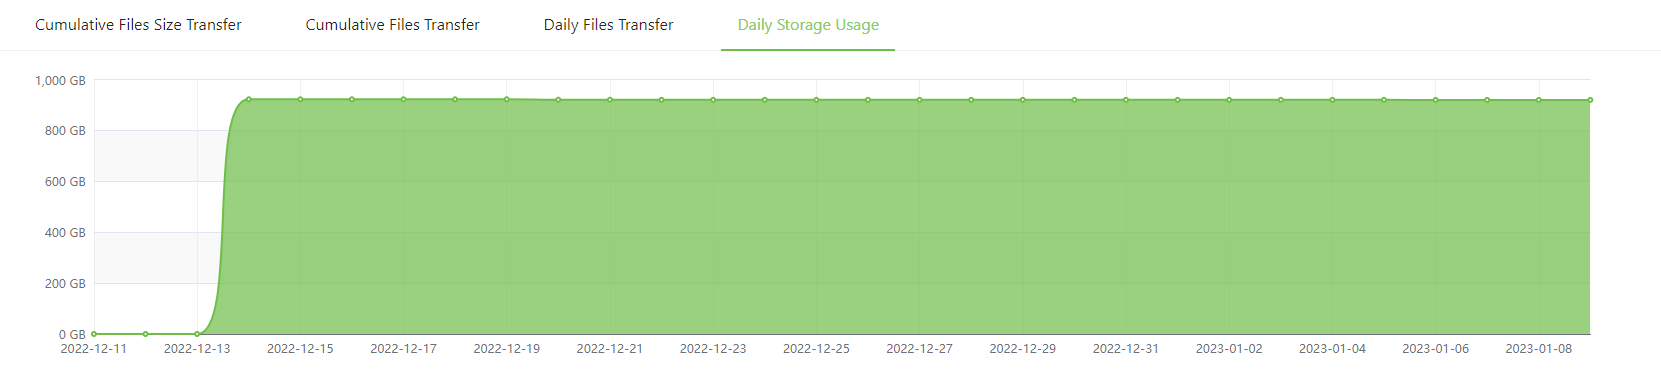
Daily Storage Usage: Total file size (GB) uploaded to Lyve Cloud daily. The data is up to the previous day.
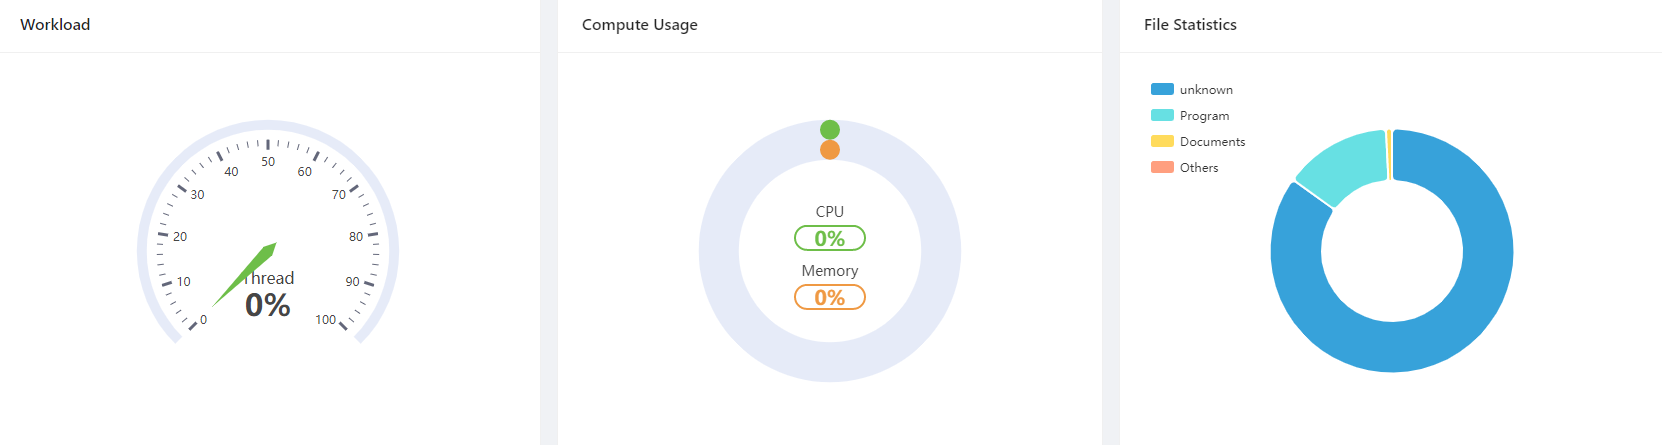
Workload: The meter displays the Thread utilization in percentage.
where, Thread utilization = Active Threads / Total Threads
Compute Usage: The graph represents CPU and memory usage.
CPU: Specifies the CPU utilized by Data Mover Worker.
Memory: Specifies the memory utilized by Data Mover Worker.
File Statistics: The chart displays file type distribution for files uploaded to Lyve Cloud
The blue color represents the Archived and Compressed files.
The yellow color represents images, photos, and drawings.
Data Mover: Displays the Data Mover's name and status. It also shows the IP address or the hostname of the Data Mover. The status can be Running or Stopped.
Notification: Displays a series of critical issues related to Data Mover performance.
Alert: Displays the count of current critical issues.
Alert Message: Displays critical issues with the corresponding error message.