Understanding the home page dashboard
After you log in to the Lyve Cloud console, you are taken to the dashboard's home page, and the headings on the page are displayed without data. However, if you have created buckets and are storing data in the buckets, the dashboard displays important details in the different sections.
The dashboard displays statistics of the storage system, usage, and estimated cost. A graphical view of usage trends, bucket count, and average usage are available.
Home page | Master Account Home page |
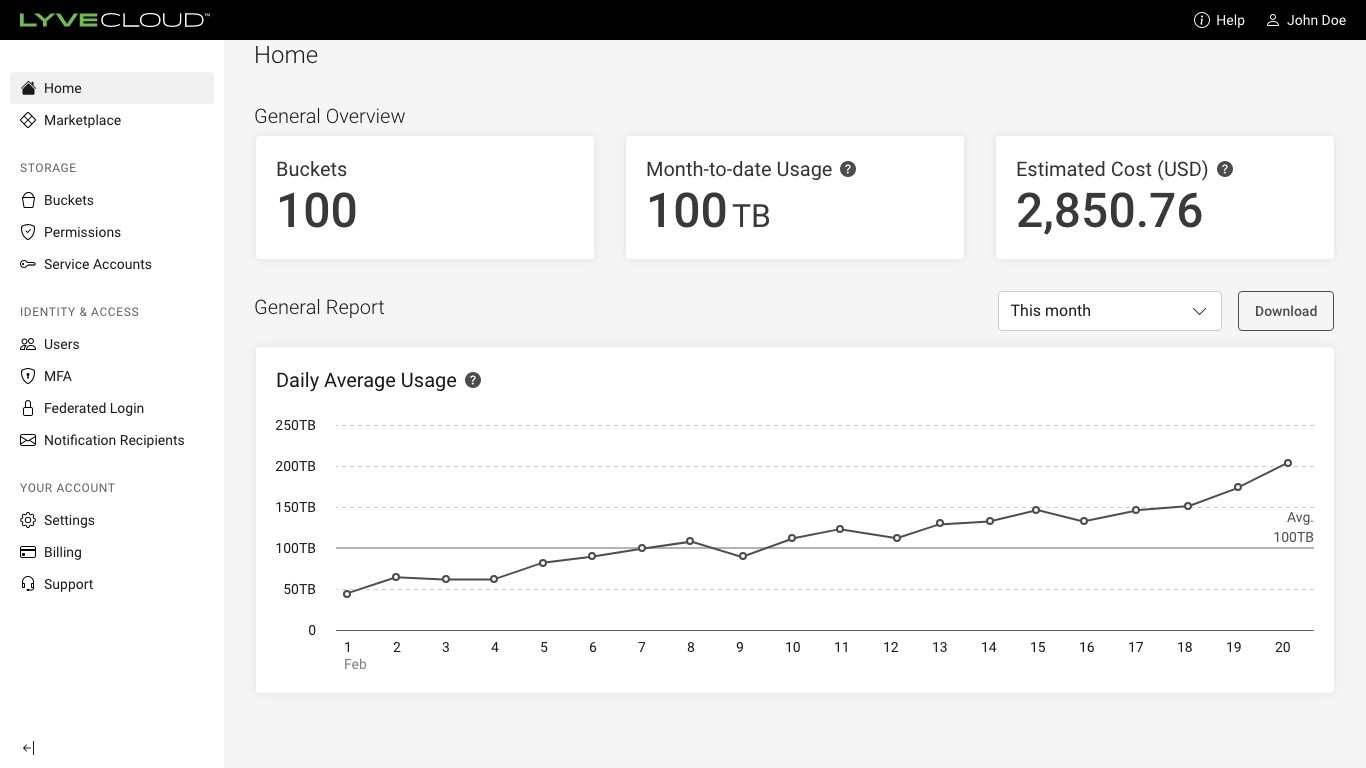 |  |
Buckets: Displays the total number of buckets.
Month-to-Date Usage: Displays the average usage of the account from the beginning of the month until the current date.
Estimated Cost: Displays the estimated monthly storage costs based on the current month’s usage trends. This cost is displayed in US dollars.
General Reports:
Daily Average Usage: Displays the daily average from a series of four usage snapshots within a 24-hour period of data stored in all the buckets.
Date range selection: Select a current month, last six months, or custom time range to view usage trends.
This month is a default selection that displays the daily average usage trend for the current month to date.
Selecting the Last 6 months shows the usage trend of the last six months. Each data point displays the monthly average for that month.
Selecting a Custom time range allows you to choose the monthly time range, and the data points display the monthly average usage.
Download the usage data in CSV format by selecting Download. Use the Date range selection to select the length of time of the report. This report shows the Date, Region Name, Bucket Name, Usage(byte), Usage (GB) in the excel sheet.
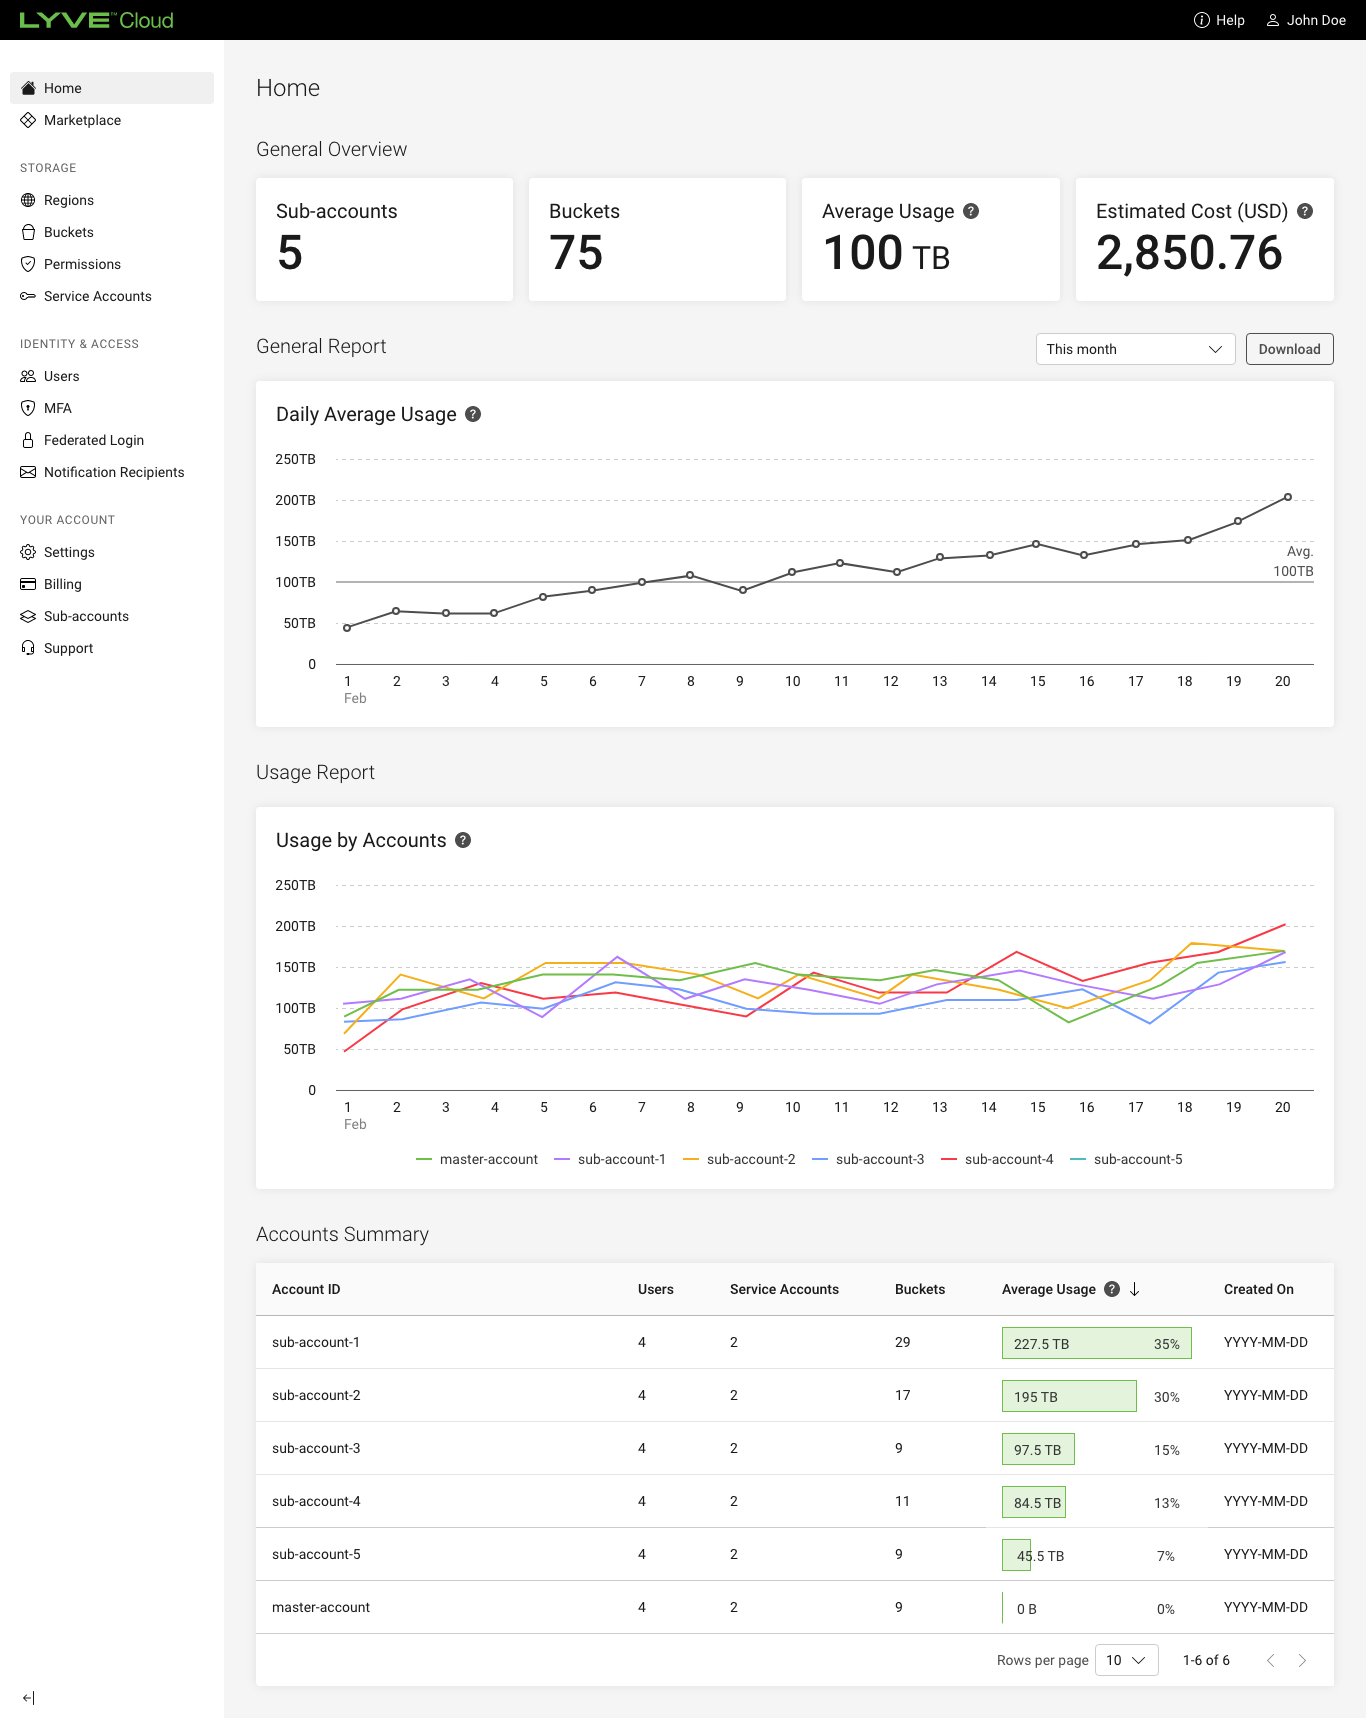
Usage Report:: Displays the usage of all the sub-accounts in the master account. The Sub-accounts Usage graph displays the usage of each sub-account on the same graph. The graph has different colour lines per account. Hovering over a particular day/month (depending on view scale) displays a tooltip with the time information for all selected accounts with the line colour, account name, and usage value per sub-account account.
Accounts Summary: Displays the summary of each sub-account.
Customers: Lists the account ID of each sub-account in the master account.
Users: Lists the number of users for each sub-account.
Service Accounts: Lists the number of service accounts for each sub-account.
Buckets: Lists the number of buckets created by each sub-account.
Average Usage: Lists the average amount of data used per day for each sub-account, from the beginning of the month to the current date.
Created On: Displays the date when the sub-account is added to the Lyve Cloud master account.